Skip to content

Statistics & charts

Instant overview of your company's activity. Protocol counts, active clients, technician performance - all in clear charts. Compare periods and track trends.

Deratix Statistics & charts — desktop application screenshot showing the feature in action
Deratix Statistics & charts — mobile app view with touch-optimized interface

Features

Protocols over time

Chart of protocol counts by days, weeks or months

Top clients

Which clients generate the most work, sorted by protocol count

Technician performance

How many protocols each technician created in the selected period

Period comparison

Current period vs last month or the same period last year

Custom date range

Preset periods or custom from-to selection

Material and installation trends

Most used materials and installation types in a chart

Colors in your design

Entire chart palette generated from your company color

Real-world examples

Instant overview of the company

After logging in you can see how the company is doing — how many protocols were created, how many active clients you have, who among the technicians was busiest. All in clear charts that you understand at a glance.

Comparing periods

How are you doing compared to last month? And compared to the same period last year? Select a time range and enable comparison — trends and changes are visible immediately.

Data that helps you make decisions

Find out which clients generate the most work, which intervention types prevail and how work volume changes over time. Useful when planning capacity, evaluating a season or preparing quotes.

  • Charts of protocols over time, work types, top clients
  • Performance of individual technicians
  • Custom date range selection
  • Comparison with previous period or last year

Blog

Protocol planning with Google Calendar for the whole service team
New features
v0.62.0

Protocol planning with Google Calendar for the whole service team

The protocol calendar connects the visit plan, a prepared protocol for the technician, and optional synchronization with Google Calendar. The office plans work in Deratix while the technician also sees their day in the calendar they normally use.

June 7, 2026 5 min
Protocols can be corrected, reviewed, and revised — anytime after submission
New features
v0.60.0

Protocols can be corrected, reviewed, and revised — anytime after submission

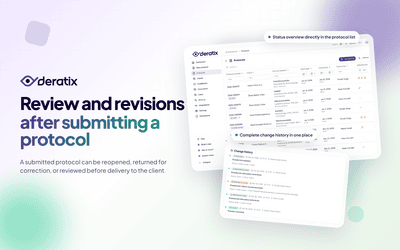
A submitted protocol doesn't have to be final. A manager can reopen it, return it to the technician for corrections, or review it before it reaches the client. Each of these options can be enabled based on what the company actually needs.

March 27, 2026 6 min
Company statistics for data-driven decisions
New features
v0.56.0 v0.58.2 +1 more

Company statistics for data-driven decisions

Dashboard statistics show in one place how much work your company actually handles, which clients and technicians carry the highest volume, and how material usage and installation types change over time.

January 20, 2026 4 min
Roles and permissions tailored to how your team works
New features
v0.55.0 v0.57.0

Roles and permissions tailored to how your team works

One person can have full control over Deratix, while the rest of the team gets access based on their actual responsibilities — and every change stays traceable.

January 19, 2026 4 min
A digital protocol for the entire service intervention
New features
v0.51.0 v0.58.3 +1 more

A digital protocol for the entire service intervention

Client, site, materials used, photo documentation, signatures, and final delivery all stay in a single record. Technicians no longer need to piece together the result from notes, attachments, and manually tracked data.

January 9, 2026 7 min

Documentation

Stay in the loop

Be the first to know about updates and improvements.

By subscribing, I agree to email processing for newsletter purposes. I can unsubscribe at any time.